Facts and figures
Explore our headline figures from our latest impact report, showing why IntoUniversity is needed to support young people facing barriers to education.
Explore our headline figures from our latest impact report, showing why IntoUniversity is needed to support young people facing barriers to education.
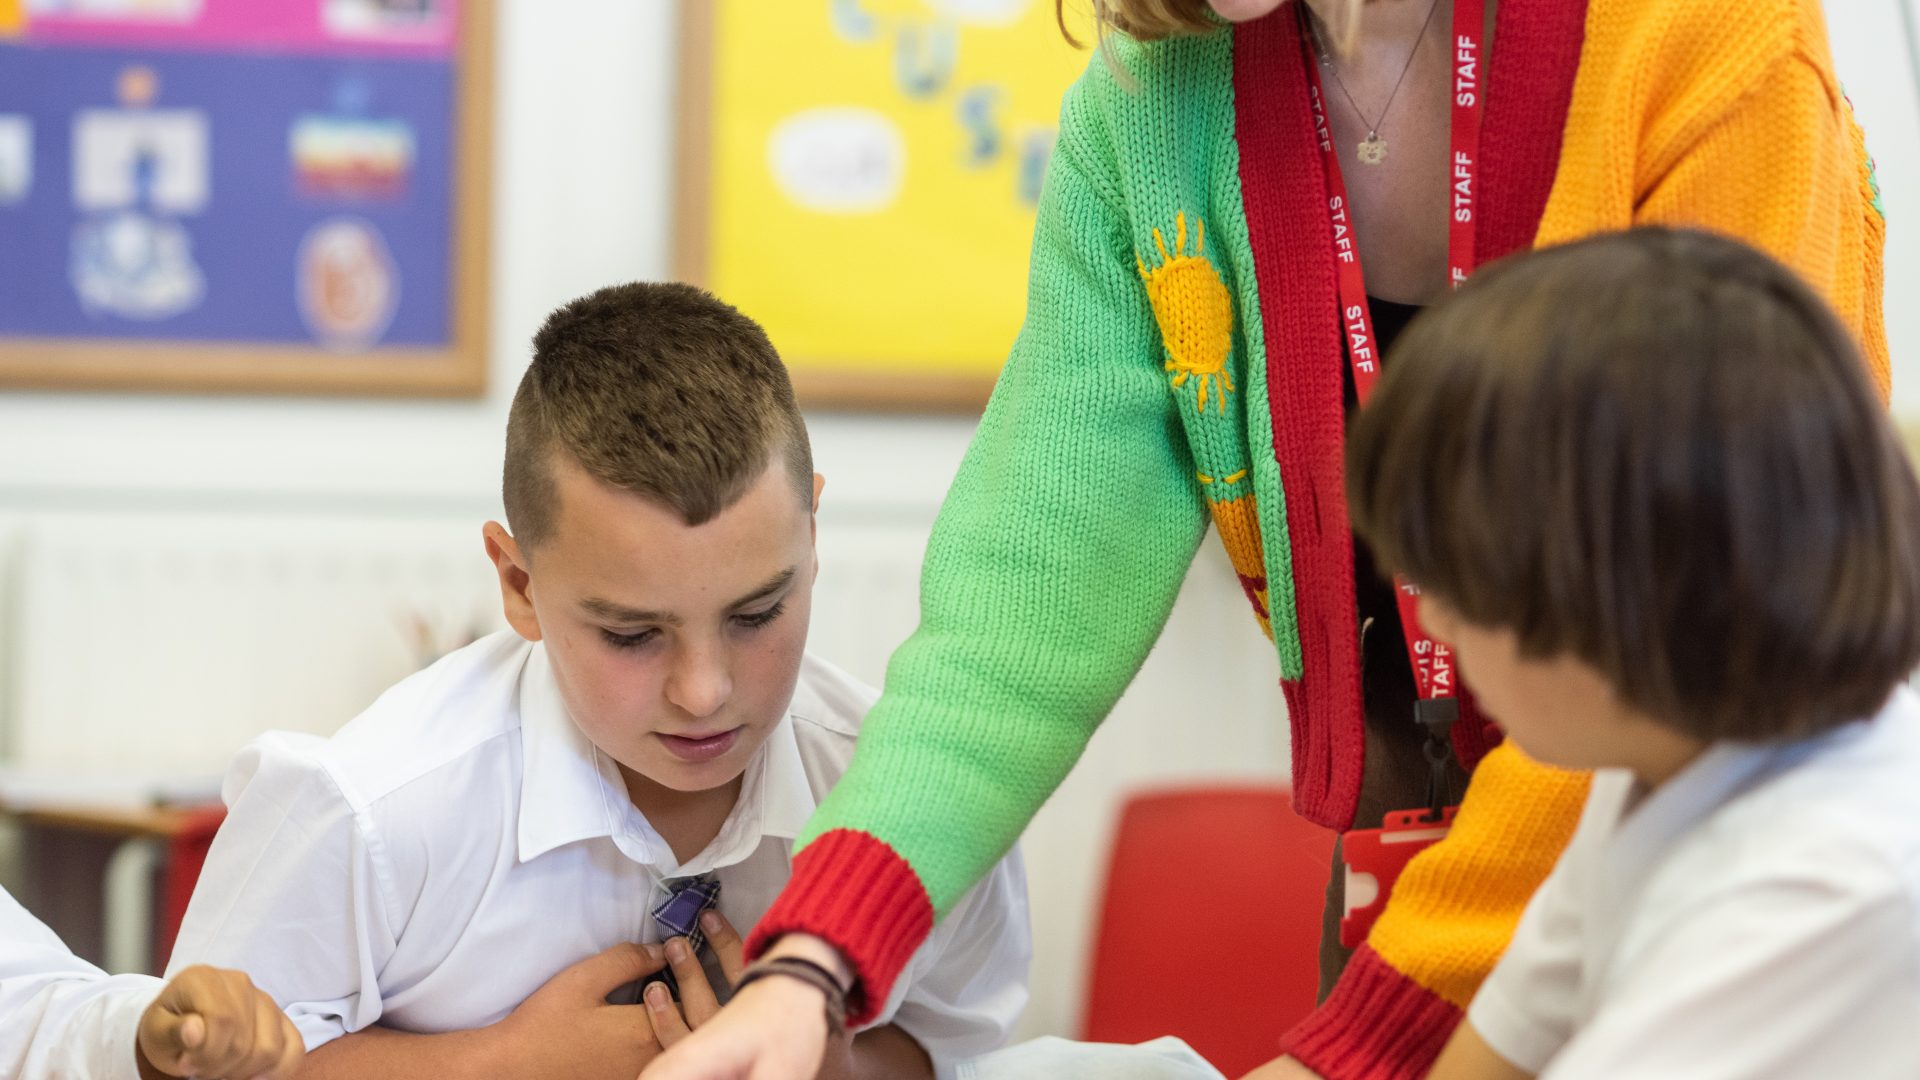
Our impact is supported by strong evidence. Independent evaluation shows that students who regularly attend our Academic Support programme achieve higher exam grades. Data on our students’ post-school destinations demonstrates that they are more likely to progress to Higher Education and other positive pathways.
Alongside this external research, we collect detailed feedback at the end of every programme. Each year, tens of thousands of student evaluation forms are analysed, with additional insight from parents, carers, and teachers. This helps us understand how effectively our programmes support young people, and whether the changes students report are reflected by those around them.
Explore our headline figures from our latest impact report below, showing why IntoUniversity is needed to support young people facing barriers to education.
In 2024/25, we worked with over
young people
volunteers
partner schools
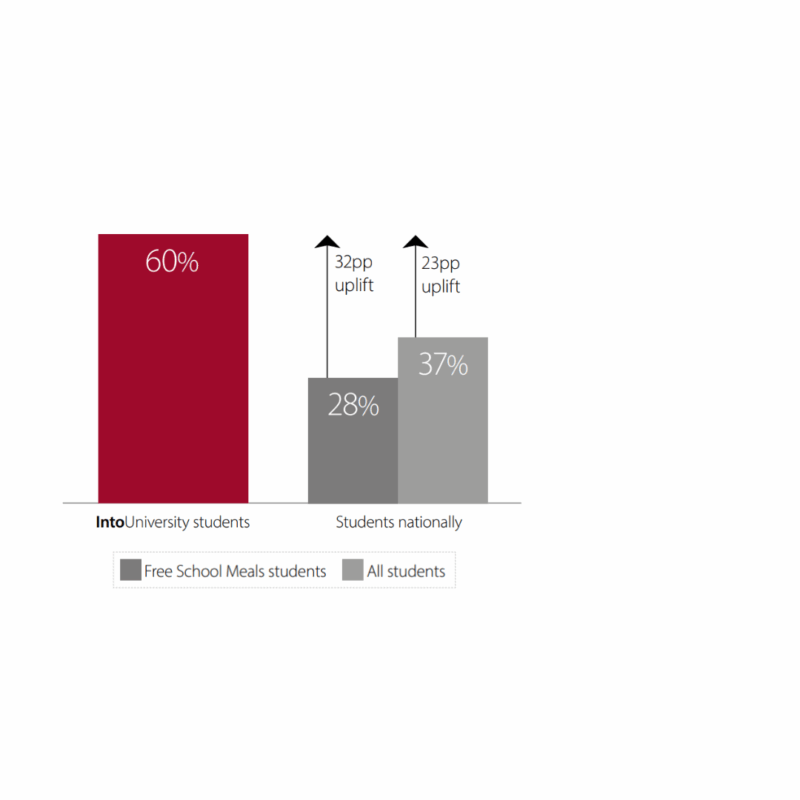
To understand the effectiveness of our programmes, we can compare the university progression rate of IntoUniversity students with the rate for similar groups of students who have not received IntoUniversity’s support. In 2025, 60% of IntoUniversity 2025 alumni progressed to Higher Education, compared to 28% of students from similar backgrounds nationally.
Find out more hereAfter taking part in our programmes:
of Academic Support students report improved grades
of teachers report that students know more about university
of parents say Academic Support raised their child’s confidence

Explore more of our evidence for the effectiveness of our programmes.
Research and Reports